When setting up new websites it’s important to go through a performance checklist. This helps guarantee success for the website or webpage as well as a positive user experience for anyone browsing the page.
Here are a list of benchmarks we use on every site we design and develop. This checklist is helpful even when following best practices because it forces you as the developer to go beyond having correctly sized images. You can have correctly sized images and still have a slow loading website.
The Quick Reference List
If you’re already familiar with where these diffrenet metrics are found here’s the quick rundown. If you aren’t sure where they are located or what they mean, continue reading.
- GTmetrix Grades
- Performance: over 90%
- Structure: over 90%
- PageSpeed Insights Grades: all ratings should be over 95%
- LCP: less than 1.2 seconds
- Fully Loaded Time: less than 2 seconds
- CLS: Less than .1
- Page Requests
- For Ecommerce: less than 50
- Everything Else: less than 25
- DOM Elements: less than 500
- Page Size: Less than 500KB
Benchmark Tools
Both of these tools are completely free to use and don’t require you sign up for an account. You can use them to check your current website or competitors, completely free.
The one benefit of signing up for a GTmetrix account is that you can choose the location from where the test is run. This can be more accurate than the default location of Vancouver, Canada.
Grades
The grades from both GTmetrix and Google’s PageSpeed Insights are helpful for a quick glance but to get better understanding where issues lie we’ll need to go much deeper.
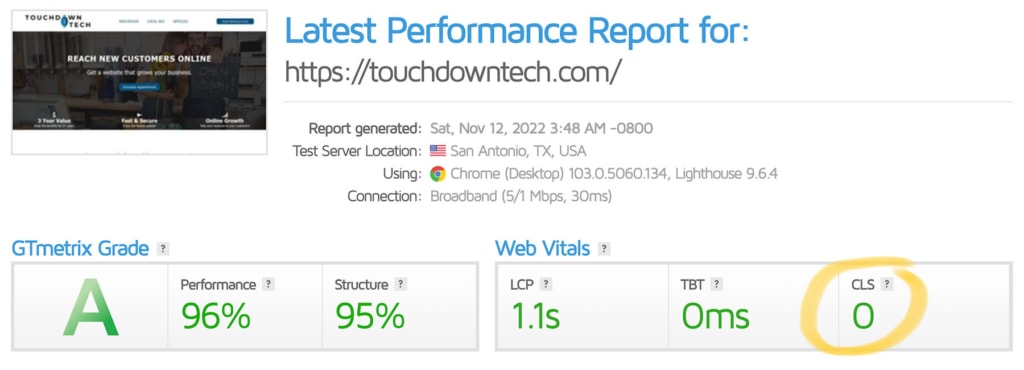
GTmetrix Grade
Both the performance and structure grades should be above 90%.
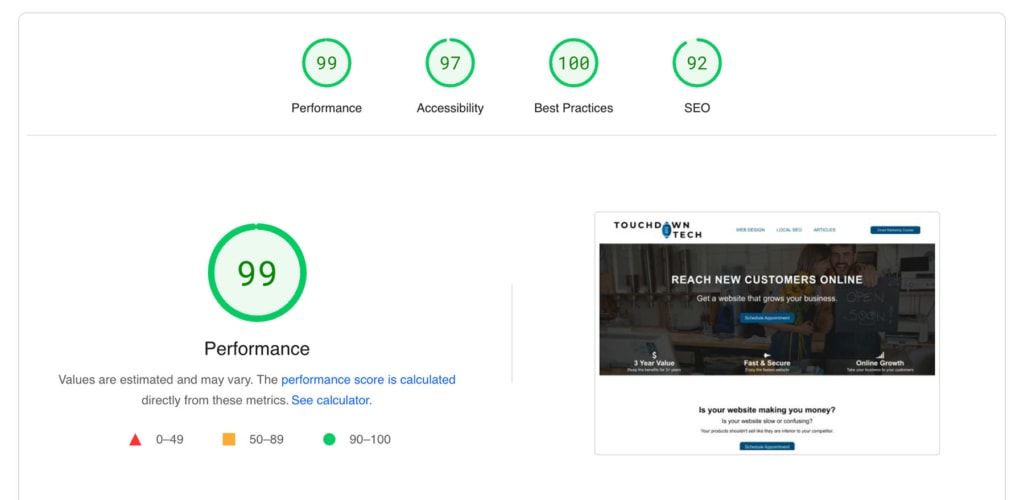
PageSpeed Insights Grades by Google
PageSpeed Insights grades performance, accessibility, best practices, and SEO. There are mobile and desktop grades. While these grades are easier to reach on desktop it should be possible to get 95% of better on all the grades.
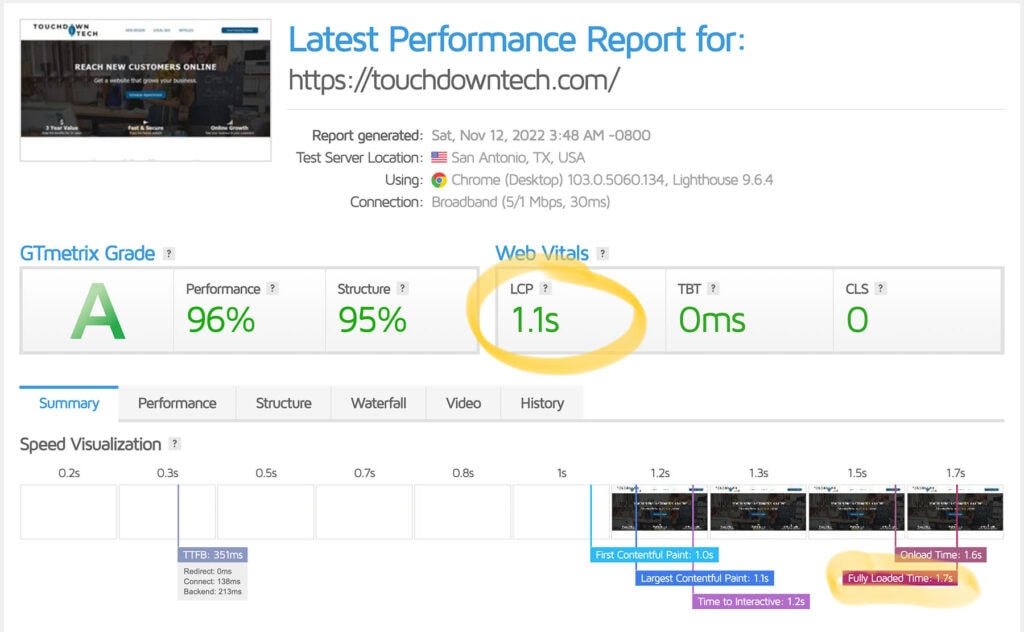
Page Load
For measuring the page load there are two important metrics to look at in the GTmetrix report, LCP and Fully Loaded Time.
- Target LCP: less than 1.2 seconds
- Target Fully Loaded Time: less than 2 seconds
The two under overlooked factors for page speed is the number of website requests loaded and the DOM count. I’ll cover these in detail after covering LCP.
LCP: Largest Contentful Paint
It measures how long it takes for the largest element to become visible. In most cases it is the hero image because that takes up the most space on the initial page load.
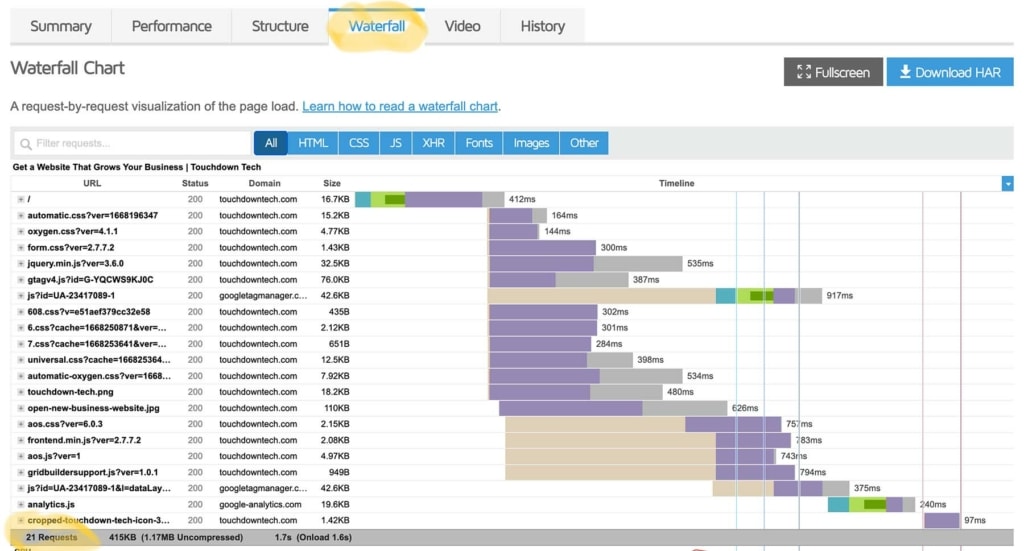
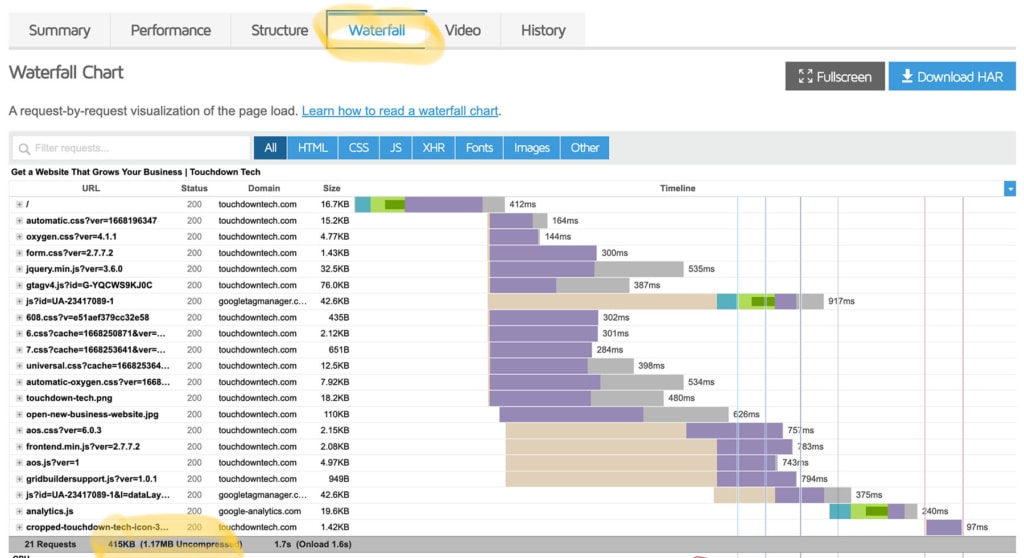
Website Requests
These are files loaded when your website is loaded in the browser. The popular types of files include JS, images, CSS stylesheets, and fonts. There are other types as well but these are the normal ones you’ll see.
The number of requests will vary depending on the functionality of your website. If you have an ecommerce website you will have more requests because more things are going on.
- Requests for Ecommerce: less than 50
- Requests for Other Sites: Less than 25
The total requests are in the Waterfall tab of the GTmetrix report. You can filter the different types of requests which is helpful when investigating which requests could be eliminated or delayed.
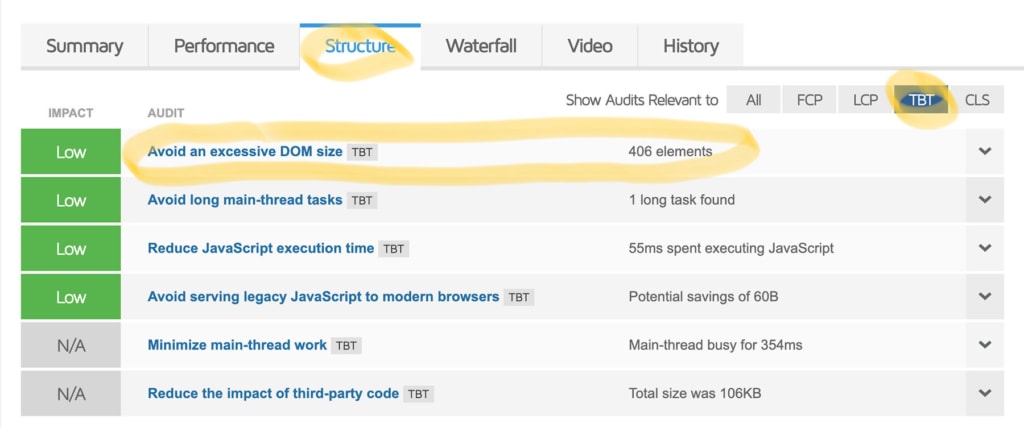
DOM Count
The DOM count is the number of HTML elements on a page. The more DOM elements that are on a page, the higher memory usage, slower style calculations, slower rendering of the page.
You can find the DOM count (or size) in the GTmetrix report. Look in the Structure tab in the TBT audit.
- Target DOM Count: less than 500 elements
Page Size
The page size is the number of kilobytes or megabytes downloaded from the web host to the browser. If your website is several megabytes usually the issue is with unoptimized images. However it can also be bloated stylesheets, fonts, or icons.
- Page Size: less than 500KB
You can find page size in the Waterfall tab of the GTmetrix report. For consistency, ignore the “Uncompressed” size.
CLS: Cumulative Layout Shift
This is an important metric to look at because it’s really annoying for website visitors if the layout of you page moves/shifts as it’s loading. That’s what CLS measures.
- CLS: less than .1
This metric is located in the GTmetrix report.